Mapping innovations in Geography
Our Geography classrooms at The McDonald College have always provided a rich and varied context for using new technologies to enhance both learning within the subject and reinforce broader technological skills. During lockdown Year 10 Geography students honed their Information and Computer Technology (ICT) skills to further their investigative study of human wellbeing and development.
Students worked meticulously to input data to develop their own interactive choropleth maps using Datawrapper. Choropleth maps are a form of thematic map which uses colour gradation, shading patterns, or symbols to depict differences between predetermined geographical areas. Choropleth maps are fantastic tools for identifying spatial variations both regionally and globally, allowing students to make informed judgements about geographical phenomenon.
Students learnt the Datawrapper program by mapping the 2020 Tokyo Olympic medal tally, as can be seen below in the work produced by Andy Lee (Year 10).
Once they had mastered the program, students then worked with more complex data sets from the United Nations Human Development Index (UNHDI) dimensions. Using these data sets students engaged with mapping global trends in health, education, gender inequality, environmental sustainability, poverty, and human security.
Delving deeper into their investigation of global variations in human wellbeing and development, students tested their own assumptions about global development issues using Gapminder’s Worldview Upgrader quiz. The quiz aims to challenge our preconceptions about what life looks like for others living around the world. Students reported that their own perceptions were generally more pessimistic than reality – a welcome relief!
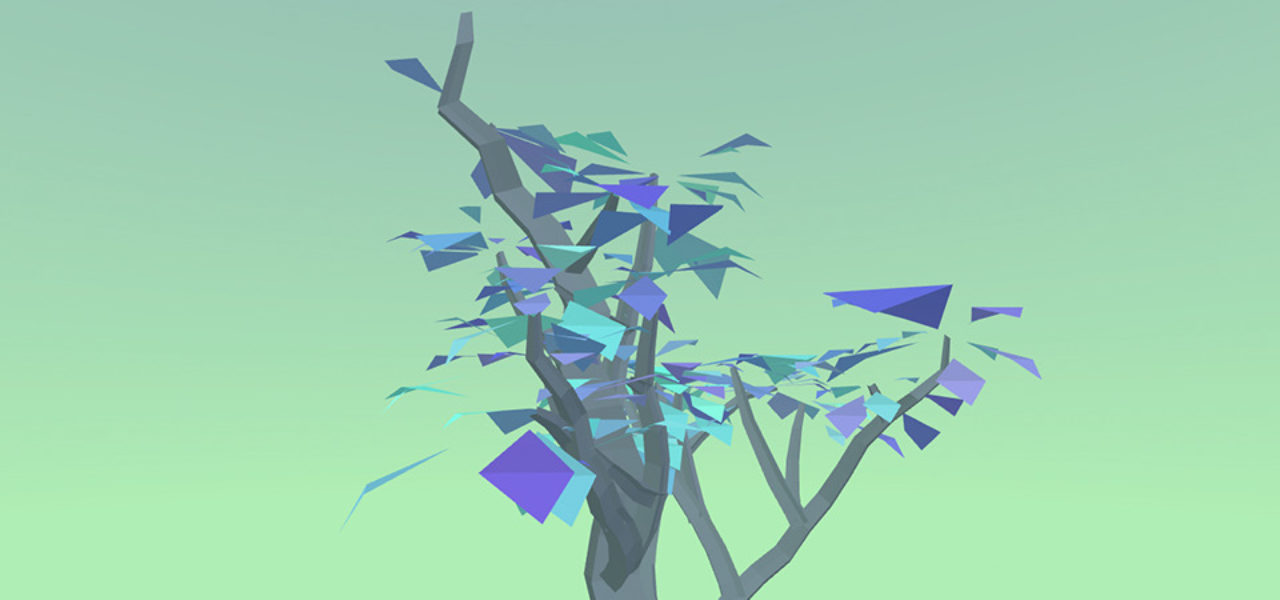
Following this, students then developed their own animated Human Development Tree, using a program by Zolabo, which uses data from the UN’s Human Development Index (HDI) to produce a striking and thought-provoking interactive tool representing the varying HDI of countries across the world since 1985. Students input their own set of ‘minimum standards’ for living and watched as their Human Development Tree simulated which countries met their minimum standards over time. On the tree each leaf represents a country, those that remain on the tree meet the minimum standard, with those that fall below dropping to the ground.
Despite the constraints of lockdown, we still engaged in authentic and relevant learning. ICT allows the students more time for observation, discussion, and depth of analysis. We found it increased our opportunities for discussion, collaboration and communication and greatly enriched our online learning journey.